Data Viz Catalogue
Here are some of the types of charts that can be easily created with Scimago Graphica.
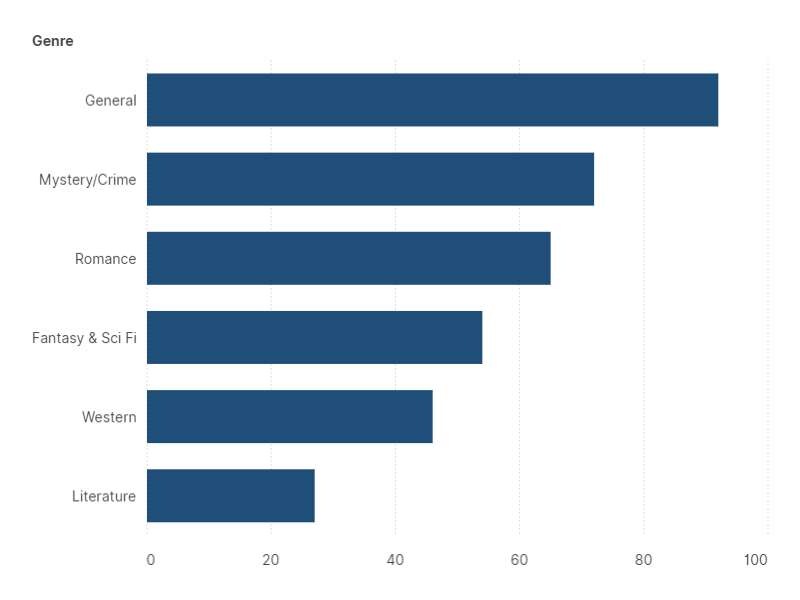
Bar chart

Clustered bar chart

Stacked bar chart

Overlapping bars

Radar chart
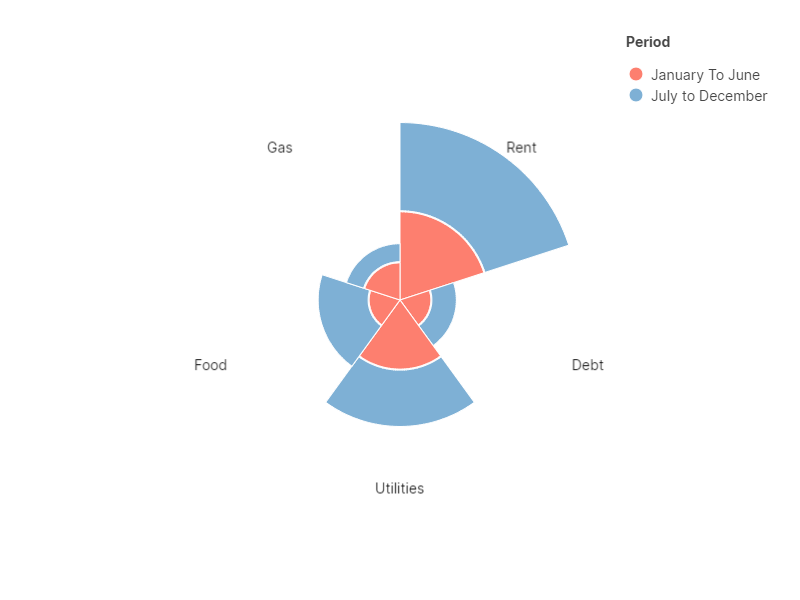
Polar chart

Heat map

Dumbbell chart

Small multiples

Word cloud

Histogram
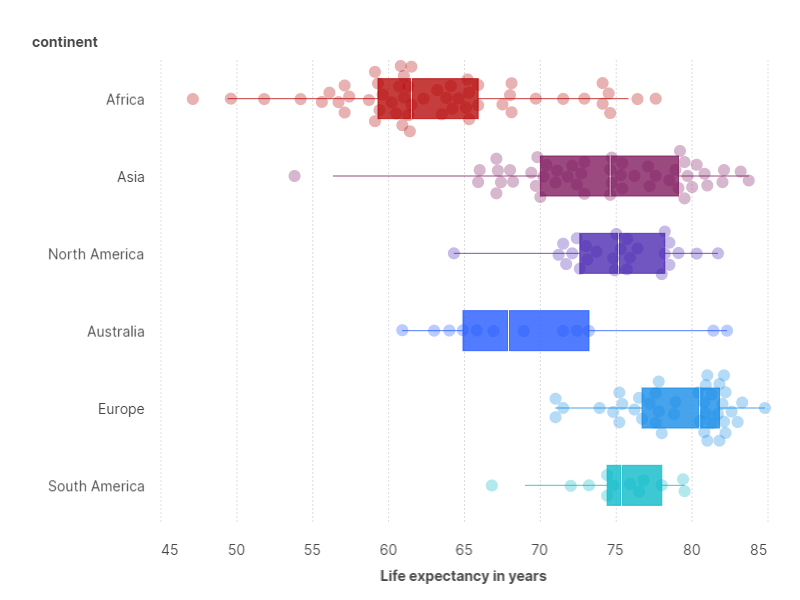
Box plot

Diverging bar chart

Beeswarm plot

Density heatmap

Convex hull chart

Scatter plot

Bubble plot

Dual axis chart

Parallel coordinates

Treemap
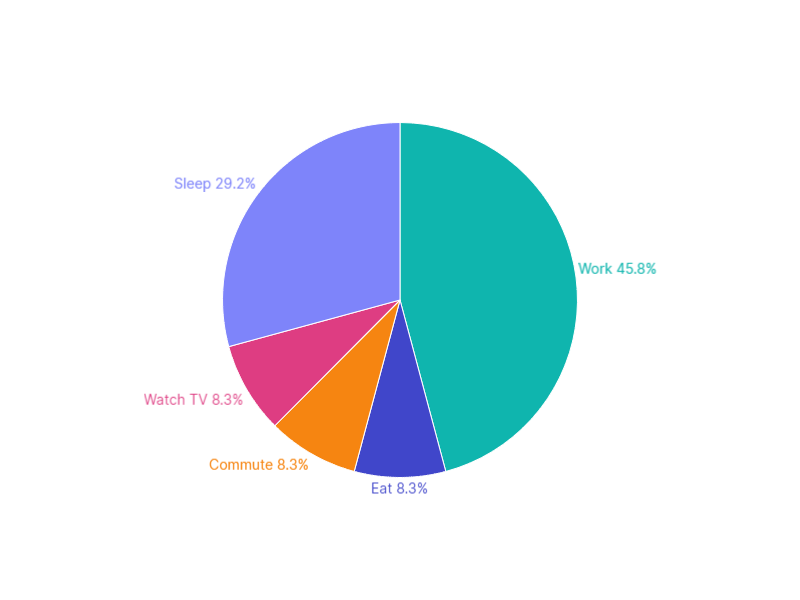
Pie chart
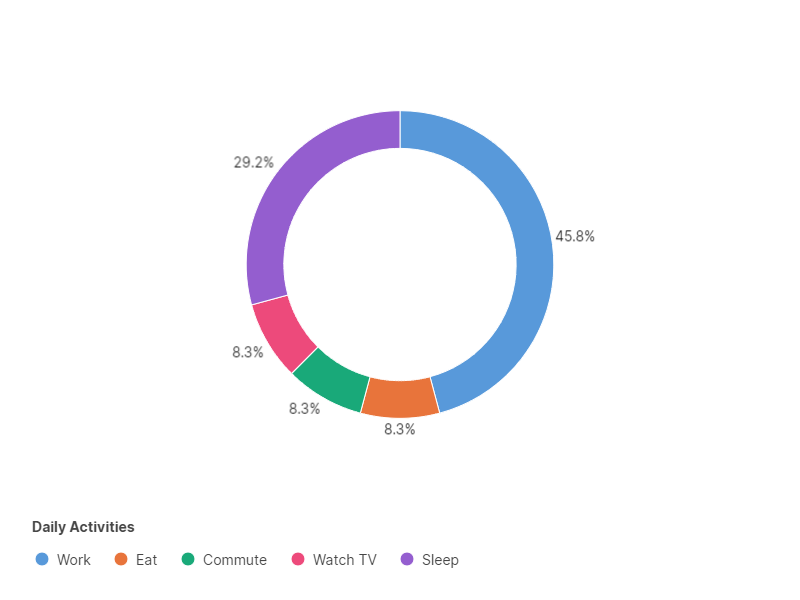
Donut chart
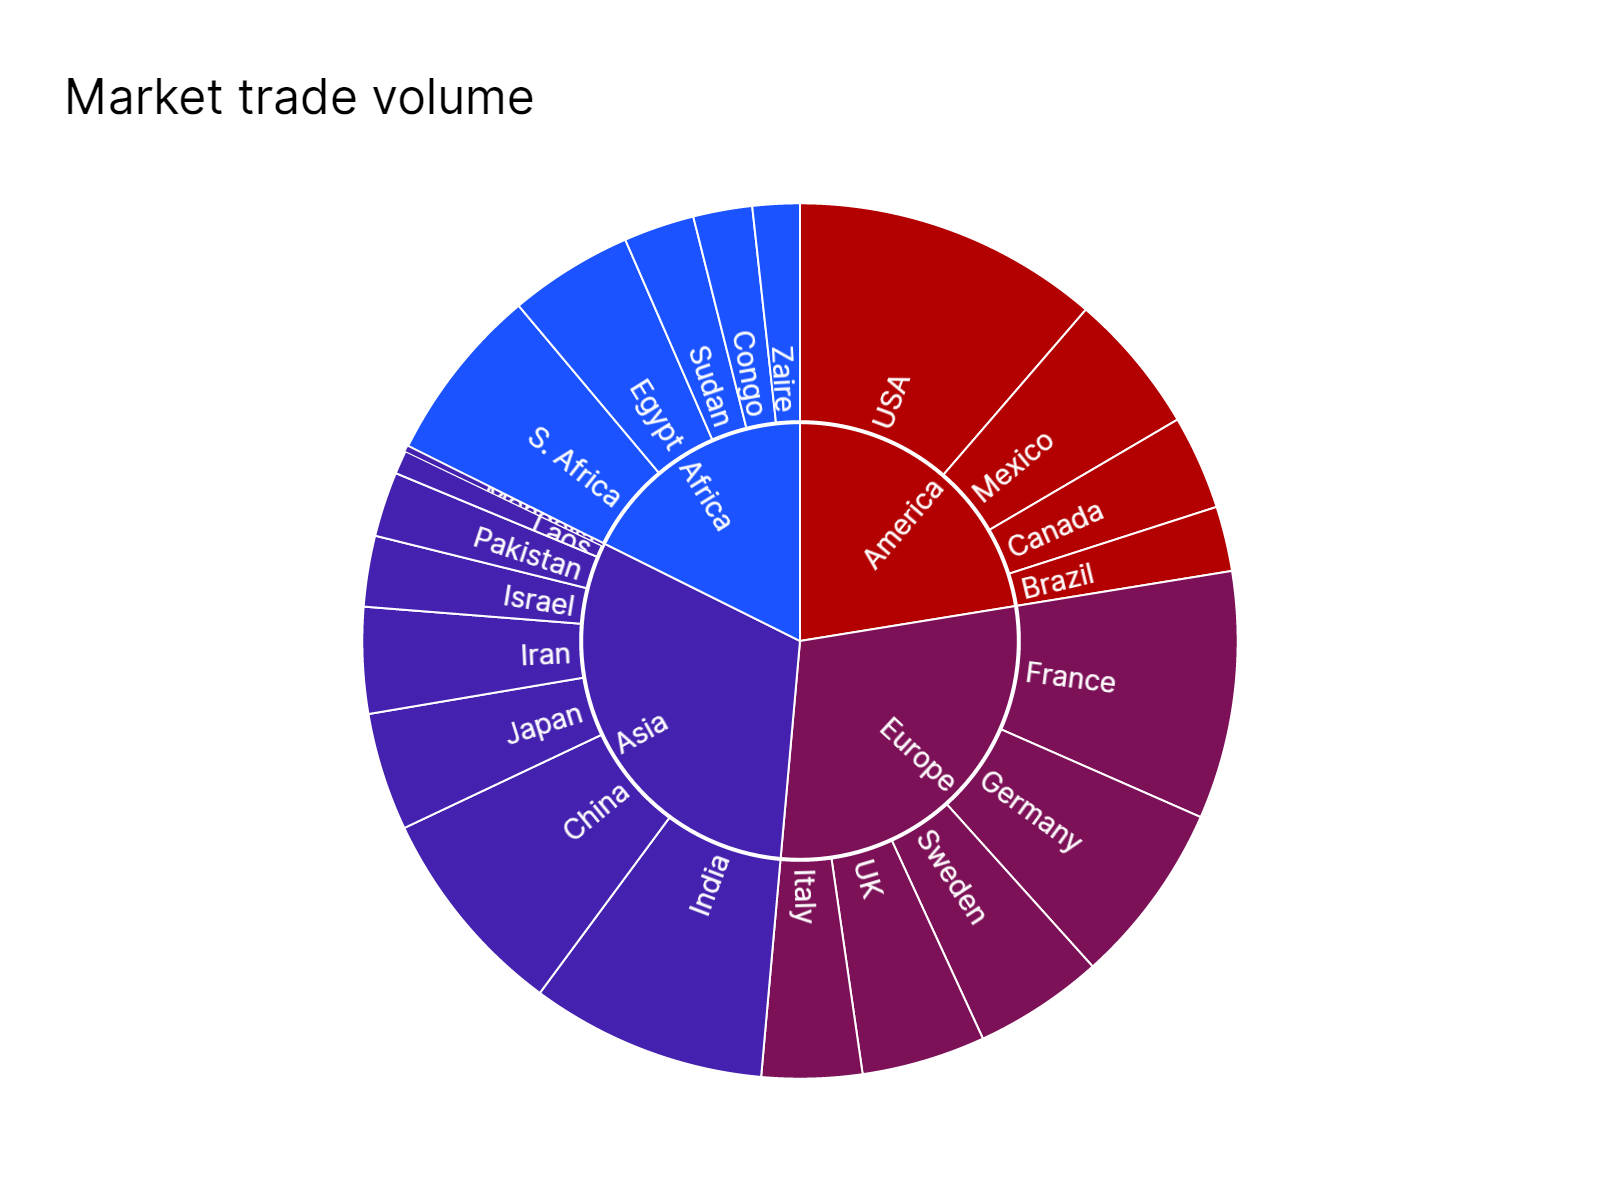
Sunburst

Alluvial diagram

Line chart

Area chart

Stream graph

Connected scatter plot
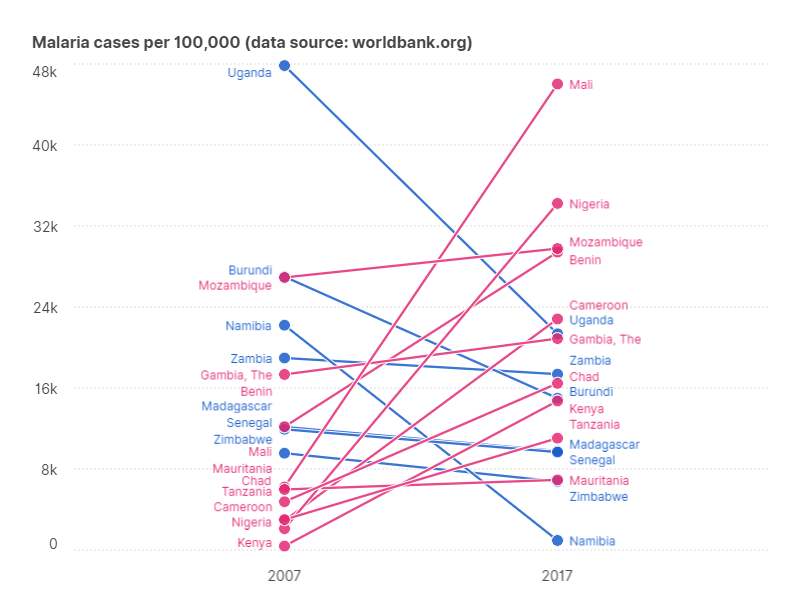
Slope chart

Dot map

Choropleth map

Bubble map

Cartogram

Dorling cartogram

Connection map
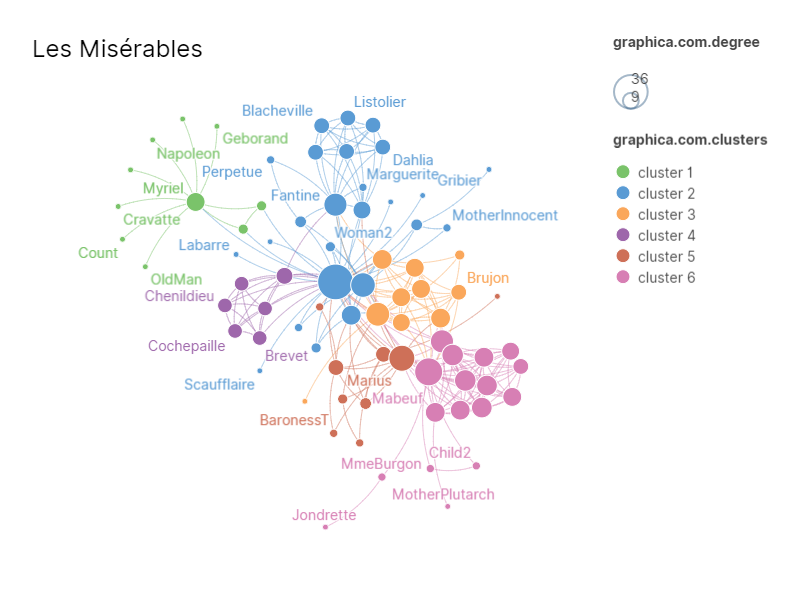
Network diagram

Circular graph