
Transform data into insights on the fly
Your data has something to say. Turn it into elegant, professional charts, maps, and networks — right in your browser.

Circular graph

View1
Id | Label | |
|---|---|---|
| 1 | 0 | Myriel |
| 2 | 1 | Napoleon |
| 3 | 2 | MlleBaptistine |
| 4 | 3 | MmeMagloire |
| 5 | 4 | CountessDeLo |
| 6 | 5 | Geborand |
| 7 | 6 | Champtercier |
| 8 | 7 | Cravatte |
| 9 | 8 | Count |
| 10 | 9 | OldMan |
| 11 | 10 | Labarre |
| 12 | 11 | Valjean |
| 13 | 12 | Marguerite |
| 14 | 13 | MmeDeR |
| 15 | 14 | Isabeau |
| 16 | 15 | Gervais |
| 17 | 16 | Tholomyes |
| 18 | 17 | Listolier |
| 19 | 18 | Fameuil |
| 20 | 19 | Blacheville |
| 21 | 20 | Favourite |
| 22 | 21 | Dahlia |
| 23 | 22 | Zephine |
| 24 | 23 | Fantine |
| 25 | 24 | MmeThenardier |
| 26 | 25 | Thenardier |
| 27 | 26 | Cosette |
| 28 | 27 | Javert |
| 29 | 28 | Fauchelevent |
| 30 | 29 | Bamatabois |
| 31 | 30 | Perpetue |
| 32 | 31 | Simplice |
| 33 | 32 | Scaufflaire |
| 34 | 33 | Woman1 |
| 35 | 34 | Judge |
| 36 | 35 | Champmathieu |
| 37 | 36 | Brevet |
| 38 | 37 | Chenildieu |
| 39 | 38 | Cochepaille |
| 40 | 39 | Pontmercy |
| 41 | 40 | Boulatruelle |
| 42 | 41 | Eponine |
| 43 | 42 | Anzelma |
| 44 | 43 | Woman2 |
| 45 | 44 | MotherInnocent |
| 46 | 45 | Gribier |
| 47 | 46 | Jondrette |
| 48 | 47 | MmeBurgon |
| 49 | 48 | Gavroche |
| 50 | 49 | Gillenormand |
| 51 | 50 | Magnon |
| 52 | 51 | MlleGillenormand |
| 53 | 52 | MmePontmercy |
| 54 | 53 | MlleVaubois |
| 55 | 54 | LtGillenormand |
| 56 | 55 | Marius |
| 57 | 56 | BaronessT |
| 58 | 57 | Mabeuf |
| 59 | 58 | Enjolras |
| 60 | 59 | Combeferre |
| 61 | 60 | Prouvaire |
| 62 | 61 | Feuilly |
| 63 | 62 | Courfeyrac |
| 64 | 63 | Bahorel |
| 65 | 64 | Bossuet |
| 66 | 65 | Joly |
| 67 | 66 | Grantaire |
| 68 | 67 | MotherPlutarch |
| 69 | 68 | Gueulemer |
| 70 | 69 | Babet |
| 71 | 70 | Claquesous |
| 72 | 71 | Montparnasse |
| 73 | 72 | Toussaint |
| 74 | 73 | Child1 |
| 75 | 74 | Child2 |
| 76 | 75 | Brujon |
| 77 | 76 | MmeHucheloup |
- Id
- Label
- Clusters
- Frequency
- Degree
- In-degree
- Out-degree
- Weighted degree
- Weighted in-degree
- Weighted out-degree
Data source variables
Computed variables
Y-axis rows
X-axis columns
Size
- SumDegree
Color
- Clusters
Label
- Label
Tooltip
- Label
Unit
Small Multiples
Subdivision
Alpha
Shape
Filters
Links
Max. number of links displayed
Color
Opacity
Width
Distribution plot
Reference lines
Line style
Page setup
Width
Height
Font
Background
Left margin
Right margin
Top margin
Bottom margin
Title
Les Misérables
Font
Align
Font size
Default color
Footer
Enter chart footer
Font
Align
Font size
Default color
Interactions
Web link variable
See what it can draw
Charts, maps and networks, all built with the same grammar. Every piece in the catalogue is a real project you can open and rebuild with your own data.
Treemap A treemap is a visualization in which the available visual space (usually rectangular) is subdivided into regions whose area represents a quantitative value.  Connection map A connection map is a graph or node-link diagram, in which the position of the nodes is geospatial.
  Stream graph Streamgraphs are very similar to area charts, except that the quantitative variable is not represented by a standard axis.
  Heat map A heat map is a representation of the relationship between two categorical variables and a quantitative variable.
  Alluvial diagram Alluvial diagrams are similar to parallel coordinate plots , but the axis variables are categorical and connections are represented by areas instead of lines.
  Circular graph Circular graphs are a type of network diagram in which the nodes are visually arranged in a circular layout.
  Scatter plot A scatter plot shows the relationship between two quantitative variables.
  Diverging bar chart A divergent bar chart allows you to compare how the quantitative values associated with two categories are distributed.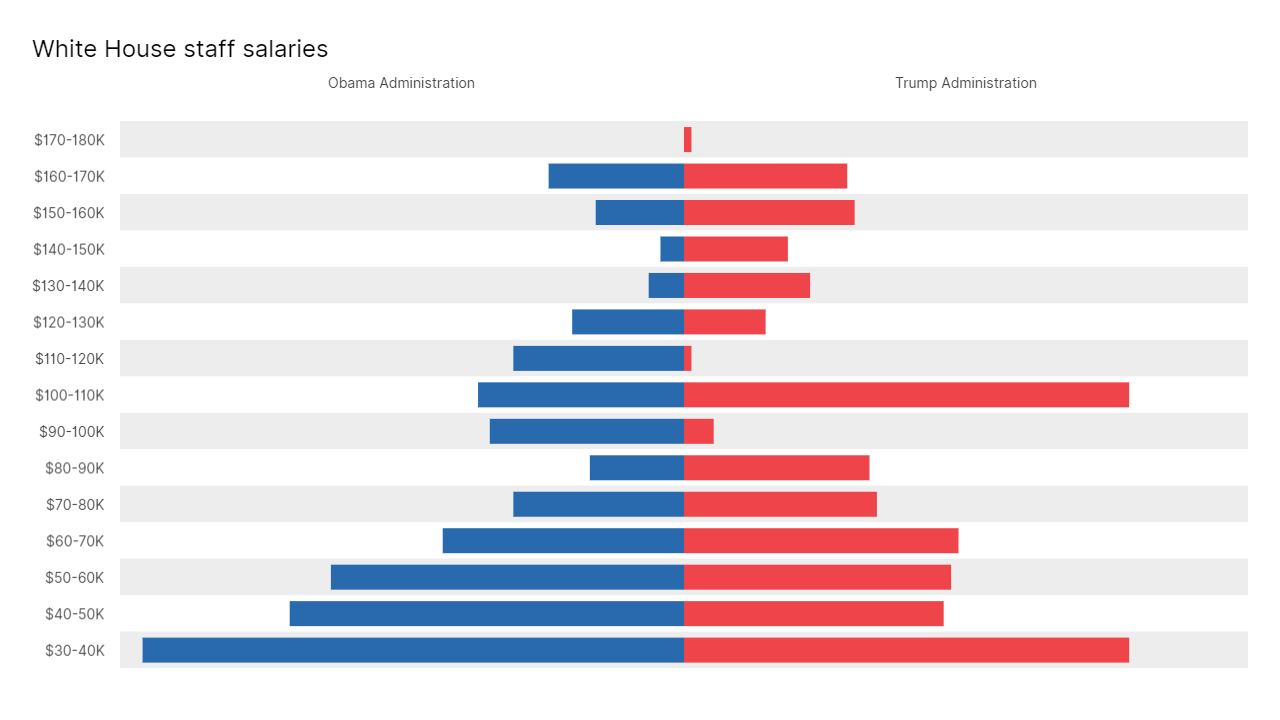
Connection map A connection map is a graph or node-link diagram, in which the position of the nodes is geospatial. Stream graph Streamgraphs are very similar to area charts, except that the quantitative variable is not represented by a standard axis. Heat map A heat map is a representation of the relationship between two categorical variables and a quantitative variable. Alluvial diagram Alluvial diagrams are similar to parallel coordinate plots , but the axis variables are categorical and connections are represented by areas instead of lines. Circular graph Circular graphs are a type of network diagram in which the nodes are visually arranged in a circular layout. Scatter plot A scatter plot shows the relationship between two quantitative variables. Diverging bar chart A divergent bar chart allows you to compare how the quantitative values associated with two categories are distributed. Learn how it thinks
20 chapters, from arranging your spreadsheet to maps, networks and clustering — starting with the one idea the whole app is built on.
Start with your own data
Drop a spreadsheet and start exploring. Nothing leaves your browser — no accounts, no uploads, no tracking.